Key Takeaways
- The A/B/C/D framework classifies properties by age, condition, location, amenities, and tenant profile — not just price.
- Class A properties command the lowest cap rates (4-5.5%) reflecting lower risk; Class D can exceed 10% but carry significant operational risk.
- The framework is market-specific — a Class B in one city may be a Class A in another.
- Investment strategy aligns with property class: core (A), value-add (B/C), opportunistic (C/D).
- Always underwrite Class C and D properties with conservative vacancy and expense assumptions.
Not all properties are created equal. The real estate industry classifies properties into four tiers — A, B, C, and D — based on age, condition, location, amenities, and tenant profile. Understanding this framework helps investors quickly assess risk-return profiles, set expectations, and communicate with other market participants.
Class A and Class B Properties
Class A properties are the highest quality assets in a given market. They are typically less than 10-15 years old (or recently renovated to that standard), located in prime locations, and feature top-tier finishes, amenities, and professional management. Class A properties attract the highest-quality tenants — strong credit profiles, stable income, and long-term lease commitments. Cap rates for Class A assets are the lowest, typically 4-5.5% in major markets, reflecting their lower risk profile.
Class B properties are a step below in age, finishes, and/or location but remain well-maintained and functional. They are usually 15-30 years old and may lack some premium amenities. Class B assets attract solid tenants — working professionals, stable families — at rents 10-30% below Class A levels. Many value-add investors target Class B properties because moderate renovations can push rents toward Class A levels. Cap rates for Class B properties typically range from 5.5-7%.
Class C and Class D Properties
Class C properties are older buildings, typically 30+ years, in average or below-average locations. They require significant maintenance, may have deferred repairs, and attract tenants with limited alternatives — often lower-income households or tenants with credit challenges. Rents are notably lower than Class A/B, but cap rates are higher, typically 7-9%, reflecting elevated risk from higher turnover, maintenance costs, and potential collection issues.
Class D properties are the most distressed tier: severely aged, poorly maintained, and often located in economically challenged neighborhoods. Vacancy rates are high, tenant quality is unpredictable, and property management is demanding. While cap rates can exceed 10%, the operational burden and risk of vandalism, code violations, or declining area economics make Class D investing suitable only for experienced operators with deep local knowledge and strong management systems.
Using the Framework in Practice
The A/B/C/D classification is subjective and market-specific. A Class B property in San Francisco would likely be a Class A property in a smaller market like Tulsa. The framework is most useful for comparing properties within the same geographic market and for communicating investment strategy to partners, lenders, and property managers.
Investment strategy aligns closely with property class. Core investors seeking stable, low-risk returns focus on Class A and Class B+ assets. Value-add investors target Class B and Class C properties where capital improvements can increase rents and reduce vacancy. Opportunistic investors pursue Class C and Class D assets with turnaround potential, accepting higher risk for potentially outsized returns. Understanding where you fit on this spectrum is essential for building a coherent portfolio.
| Attribute | Class A | Class B | Class C | Class D |
|---|---|---|---|---|
| Age | <15 years | 15-30 years | 30+ years | 40+ years |
| Cap Rate Range | 4.0-5.5% | 5.5-7.0% | 7.0-9.0% | 9.0%+ |
| Tenant Profile | High credit | Stable | Credit-challenged | High risk |
| Management Need | Professional | Professional | Intensive | Very intensive |
| Strategy | Core | Value-add | Opportunistic | Turnaround |
Property classification framework with typical attributes by class
Visualizing the Risk/Return Spectrum
The relationship between property class, risk, and yield can be visualized as a spectrum. Class A offers the lowest risk but tightest yields (lowest cap rates). As you move to Class B and C, risk increases (older systems, more maintenance, credit risk), but investors demand higher yields to compensate. Class D sits at the extreme, offering the highest theoretical yields but with operational risks that can easily erode returns.
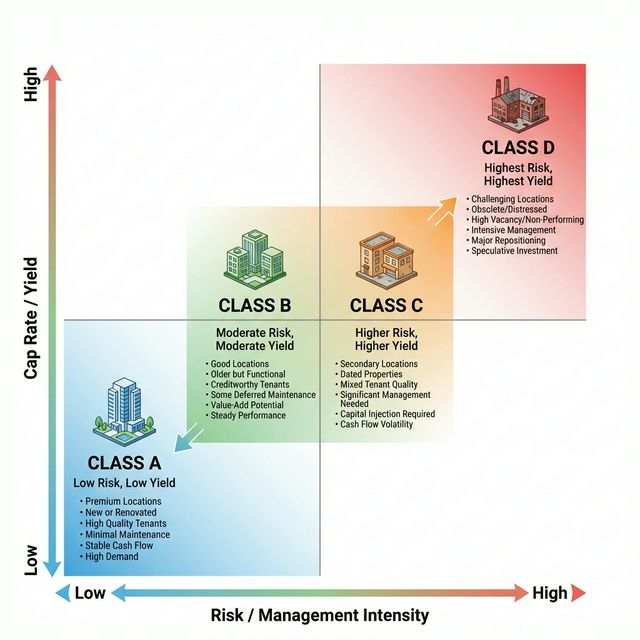
Matrix chart comparing Class A, B, C, and D properties across Risk and Yield dimensions
Key Takeaways
- ✓The A/B/C/D framework classifies properties by age, condition, location, amenities, and tenant profile — not just price.
- ✓Class A properties command the lowest cap rates (4-5.5%) reflecting lower risk; Class D can exceed 10% but carry significant operational risk.
- ✓The framework is market-specific — a Class B in one city may be a Class A in another.
- ✓Investment strategy aligns with property class: core (A), value-add (B/C), opportunistic (C/D).
- ✓Always underwrite Class C and D properties with conservative vacancy and expense assumptions.
Sources
Common Mistakes to Avoid
Assuming property class is fixed and permanent.
Consequence: Missing value-add opportunities where renovation can move a property from Class C to Class B, or failing to recognize Class B properties declining toward Class C.
Correction: Evaluate current class and potential class after improvements. Class can change through renovation, neglect, or neighborhood transformation.
Applying Class A underwriting assumptions to Class C or D properties.
Consequence: Using 5% vacancy and 35% expense ratios for properties that realistically experience 15-25% vacancy and 40-55% expenses.
Correction: Adjust vacancy and expense assumptions to match the property class. Budget 15-25% vacancy for Class D and 40-55% operating expense ratios.
Test Your Knowledge
1.A Class B property is typically how old?
2.Why is the A/B/C/D classification considered market-specific?
3.Which investment strategy typically targets Class B and Class C properties?